


Digital Acceleration for a USA Real Estate Consulting Brand
The Real Estate Challenge in a Competitive U.S. Market
The client, a fast-growing real estate consulting firm with an established network of agents, faced the challenge of scaling in a highly competitive market while maintaining personalized engagement with buyers, renters, and investors across top-performing real estate cities in the U.S.
Despite a strong offline presence and agent network, their digital ecosystem was fragmented:
- No structured lead funnels
- Low website visibility in organic search
- Unoptimized social presence
- Generic landing pages not tailored to location-specific demand
- Lack of automation in property inquiries & follow-ups
They wanted to boost leads, streamline marketing ROI, and build credibility in key metros—especially Austin, Dallas, Miami, and Los Angeles.
By thinking on behalf of our clients every day, we anticipate what they want, provide what they need & build lasting relationships. These are the concept that shape our distinctive culture & differentiate us from others.
We guide our clients through difficult issues, bringing our insight and judgment to each situation. Our innovative approaches create original solutions to our clients

Our Strategic Rollout
Ktricks crafted a multi-city digital playbook, tailored for the U.S. real estate market:
Hyperlocal Lead Funnels
- Built city and zip code-based landing pages (e.g., “Homes for Rent in South Austin,” “Condos in Brickell Miami”).
- Integrated lead forms with CRM tools and local MLS for real-time listings.
- Emphasized mobile-first design with dynamic CTAs and agent contact widgets.
Revenue-Focused SEO
- Implemented local SEO campaigns targeting “Buy vs Rent” keywords by city.
- Developed blog content and city-specific real estate guides (e.g., “Top Neighborhoods in Atlanta to Invest in 2024”).
- Optimized Google My Business and review strategy for each city office.
Precision Targeting via Paid Ads
- Launched Meta, Google, and YouTube Ads segmented by:
- First-time buyers
- Property investors
- Home sellers
- Landlords looking for property managers
- Created video ads, agent spotlight campaigns, and market update carousels to build trust.
Automation & Lead Qualification
- Added auto-responders and chatbot flows on landing pages to filter leads.
- Tracked performance with dynamic dashboards integrated into the client’s internal system.
Results After 6 Months of Execution
Our data-driven strategy unlocked scalable growth:
Metric | Before Ktricks | After Ktricks | % Change |
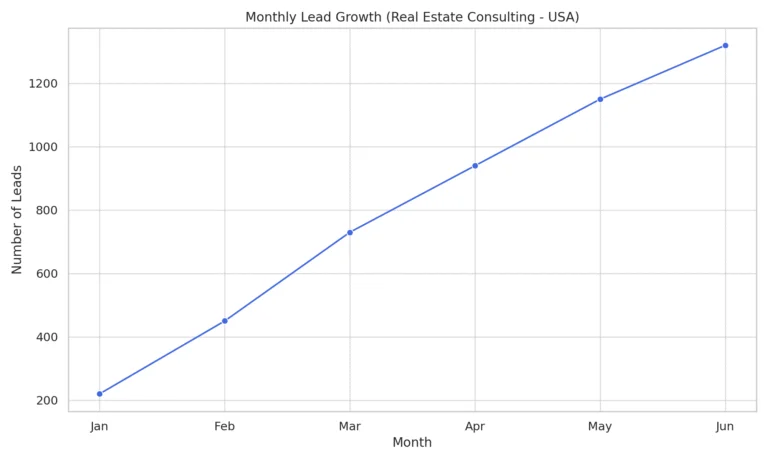
Monthly Leads | 220 | 1,320+ | 🔼 6X |
Monthly Revenue | $75,000 | $300,000+ | 🔼 4X |
Lead-to-Conversion Ratio | 4.3% | 10.5% | ✅ Doubled |
Average CPL (USA) | $52 | $24.60 | 🔽 -52% |
Website Traffic (Organic) | 3,200/month | 11,800/month | 🔼 3.7X |
Key Learnings
- Hyperlocal personalization wins in the U.S. real estate game.
- Integrated ad + SEO + CRM strategy ensures lead quality and conversion.
- Agent-based marketing builds credibility and reduces buyer hesitation.
Performance Snapshot by Location
City | Lead Share | Conversion Rate |
Austin, TX | 28% | 13.5% |
Miami, FL | 22% | 11.7% |
Dallas, TX | 18% | 9.8% |
Los Angeles | 16% | 7.9% |
Charlotte, NC | 10% | 10.2% |
Others | 6% | 5.1% |
Before & After Summary
Before Ktricks | After Ktricks | |
Digital Strategy | Generic | City-based Funnels |
Ads Targeting | Broad Geo/Interest | Segmented Personas |
Lead Handling | Manual | Automated Chatbot CRM |
Property Pages | Static Listings | Dynamic Local Pages |
Social Content | Low Engagement | High-Performing Reels |
Conclusion
From static to strategic, we helped this U.S. real estate brand turn digital chaos into a revenue-generating machine. With smart city-level funnels, conversion-optimized landing pages, and high-impact ads, Ktricks scaled their presence in America’s hottest real estate zones.
💡 Want similar results for your real estate business?
Partner with Ktricks. We don’t just run campaigns — we build growth engines.
Here are the two visual assets for the case study of the Real Estate Consulting Company (USA Market):
- Monthly Lead Growth
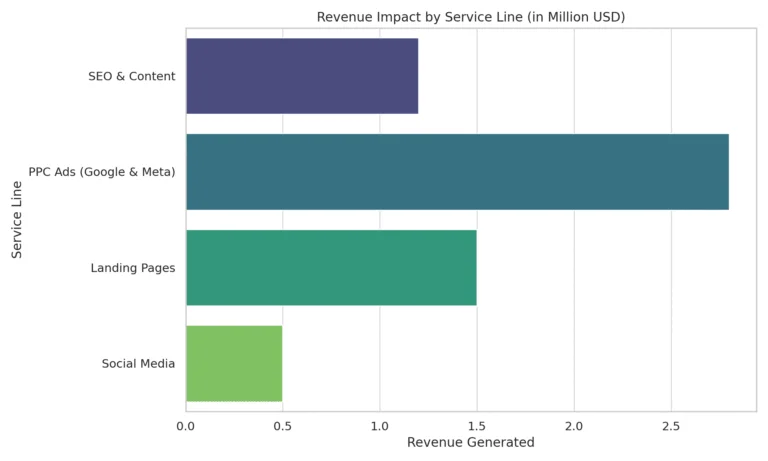
This graph visualizes the significant increase in leads over a 6-month period after the implementation of our digital marketing strategy. - Revenue Impact by Service Line
This horizontal bar chart breaks down the revenue generated by each service channel, highlighting the most profitable ones like PPC Ads and SEO.